All we need to know about On Balance Volume.
Stock Market Basics
One of the most important technical analysis indicators in finance for analyzing and forecasting price changes in a variety of assets, such as stocks and cryptocurrencies, is On Balance Volume (OBV). This indicator evaluates the correlation between trading volume and an asset's price changes to assist traders and investors in making well-informed decisions. This blog will go into great detail on the formula, calculation process, practical application, significant differences from comparable indications, limitations, and, ultimately, the significance of the OBV indicator in trading systems.
What is On Balance Volume (OBV)?
In order to drag attention on the purchasing and selling pressure present in the market, the Balance Volume (OBV), a momentum indicator, combines price movement and trade volume. For traders, it's a useful tool because it is usually used to validate current trends and spot possible reversals. The OBV indicator involves adding trading volume to the OBV when the asset price closes higher than it did at the previous closure. The trading volume is deducted from the OBV in the event that the price ends lower than it did at the previous closure. On-balance volume (OBV) assesses both positive and negative volume flow as well as the direction of trading. It appears as a single line that can give investors information about market participants intentions, which they can use to guide their trading decisions and decide when to purchase or sell an item. OBV, however, leaves out important details regarding the financial asset, which may cause misunderstandings. As a result, traders ought to use lagging indicators to balance OBV.
Additional Read : What is Bull Market and How can Investors Benefit from one?
How On Balance Volume (OBV) Operates?
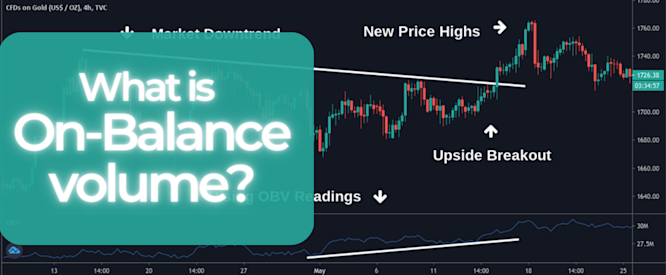
Volume is assumed to move before price movement in order for the OBV indicator to function. Put differently, shifts in trading volume typically come before changes in market prices. An increase in OBV suggests a bullish trend since it shows that trading volume on days with positive price movements is greater than that on days with negative price movements. On the other hand, a declining OBV indicates a bearish tendency, with the majority of volume occurring on days with negative price moves.
Formula
The formula for calculating On-Balance Volume is straightforward:
OBV = Previous OBV + Current Volume if the closing price is higher than the previous closing price.
OBV = Previous OBV – Current Volume if the closing price is lower than the previous closing price.
OBV = Previous OBV if the closing price is the same as the previous closing price.
Observing the On Balance Volume
The entire trading in On Balance Volume of an asset shows if it is coming into or going out of a particular security or currency pair. An overall volume, including positive and negative, is represented by the OBV. In order to calculate the OBV, three rules are followed.
OBV is calculated using the following sequential steps:
Start with an initial OBV value, which is often set at zero or the closing price of the first day.
Find out if the closing price is the same, greater, or lower than the one from the previous day for each day that follows.
Using the previously given formula, modify the OBV value.
Dissimilarities:-
1. What separates On Balance Volume from the Accumulative distribution line?
Two volume-based cumulative indicators are On Balance volume and the Accumulation distribution line. A time series plot, which is a chart that can be compared to the underlying security, is created by adding or subtracting periodic values. The relative closeness of these two indicators determines their differences. In the Accumulation Distribution Line, the close is compared with the high-low range while in the OBV, it is compared with the previous close.
While A/D takes into account the trading range for the day, OBV only looks at how the closing price compares to the prior closing price. A/D can offer a more thorough picture of the pressure on purchasing and selling during a specific time frame.
Also: Visit Alphabots
2. What Separates Volume-Price Trend from On-Balance-Volume Trend?
The Volume-Price Trend (VPT) indicator integrates price movement and volume, similar to OBV. But it's also more complicated than OBV because VPT takes into account the percentage change in price. Even though both indicators reveal market patterns, traders may favour one over the other depending on their own tastes and plans.
Additional Read : 7 Best Bearish Future and Options Trading strategies.
Disadvantages of On Balance Volume
OBV's primary defect is its tendency to provide erroneous signals. When the OBV line travels against the direction of the price trend, a misleading signal may be indicated, for instance, if the price is rising while the OBV line is trending downward. This might happen if there is an abrupt spike in loudness that doesn't last for the entire duration. In order to verify the trend, traders need to use additional indicators and be cautious of misleading signals.
The fact that OBV is a lagging indication is another drawback. This implies that it can take some time for the OBV line to move jointly with the price movement. For instance, an OBV line that remains flat when a stock's price is already in an uptrend may be a sign of a signal delay.
OBV has its limitations, just like any other indication. In low-liquidity markets, where volume swings might be deceptive, it might not function well. Moreover, sudden price differences may affect how accurate OBV readings are. To gain a deeper understanding of the state of the market, traders can combine OBV with additional indicators and analytical methods.
The on-balance volume is significant since it is often believed that buying and selling pressure precedes price movements. In particular, divergences should always be taken into consideration as a potential reversal of the current trend. It is recommended to use OBV in conjunction with other technical analysis tools, as is the case with most indications.


