Market Insights: Last Week's Performance and Guidelines for Monday. (July 29, 2024)
Other
Market overview
Bank Nifty – Market Overview
The Nifty Bank index continues to underperform, and despite a recovery in the broader markets, the Bank Nifty index fell further. Although the lower time frame readings are oversold, there are no indicators of reversal, so traders should wait for confirmation before bottom fishing here. Immediate support is at 50600, followed by 50000, with resistance at 51600 and 52000.
Nifty – Market Overview
The Nifty started the F&O expiry session on a negative note due to weak global cues. However, the index eventually recovered from the morning lows and ended flat.
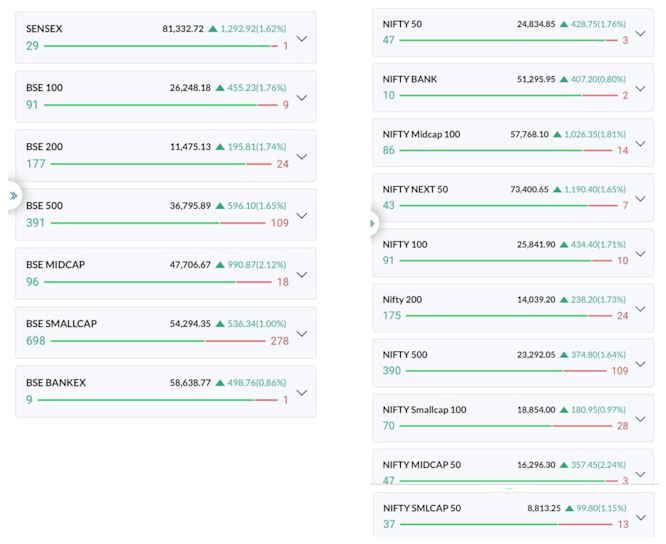
Following the budget session, the Nifty has consolidated inside a range that appears to be a time-based correction phase. This was well anticipated, given the index had already surged ahead of the event and the RSI readings were overbought. However, market breadth is positive in last couple of sessions as strong buying demand persists in the broader markets. The RSI on the hourly readings has now shown a bullish crossing, indicating that the pullback move may continue. The Nifty's immediate support is currently at 24200, followed by the 24000-23900 zone. On the higher side, resistance will be evident between 24550 and 24600. As the index continues to consolidate, we continue to recommend looking for stock-specific trading opportunities where superior opportunities are seen.
NIFTY Levels | SENSEX Levels | BANKNIFTY Levels | FINNIFTY Levels | |
Support 1 | 24270 | 79630 | 50620 | 22920 |
Support 2 | 24130 | 79220 | 50370 | 22800 |
Resistance 1 | 24490 | 80300 | 51070 | 23120 |
Resistance 2 | 24560 | 80550 | 51260 | 23200 |

Img source: moneycontrol

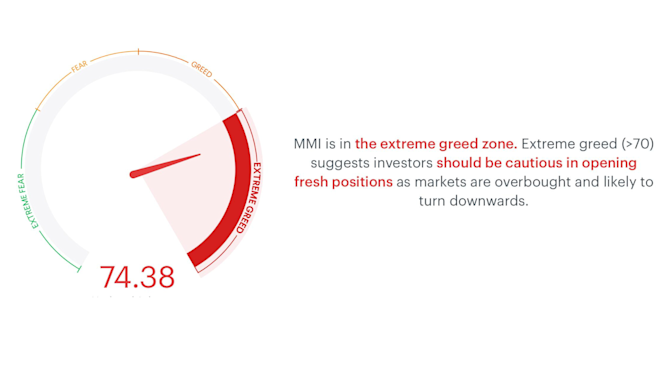
Img source: tickertape
Guidelines for Monday (29th July 2024)
Bank NIFTY can rise beyond 52,000 or fall below 50,500, depending on global cues. Bank Nifty has developed an outside day pattern, indicating probable price expansion. In the short, this may result in a bullish reversal. Resistance is expected between 52,000 and 52,600, with support between 50,500 and 49,500.
NIFTY can rise beyond 25,400 or fall below 24,300, depending on global cues. Nifty has broken out of a downward consolidation on the daily chart, showing increased optimism. A significant green candle following numerous minor ones indicates a bullish trend. As long as it is over 24,500, the trend is expected to be favorable. Resistance levels range from 25,000 to 25,500, with support between 24,500 and 24,000


