Bearish-Harami-CandleStick-Pattern
Stock Market Basics
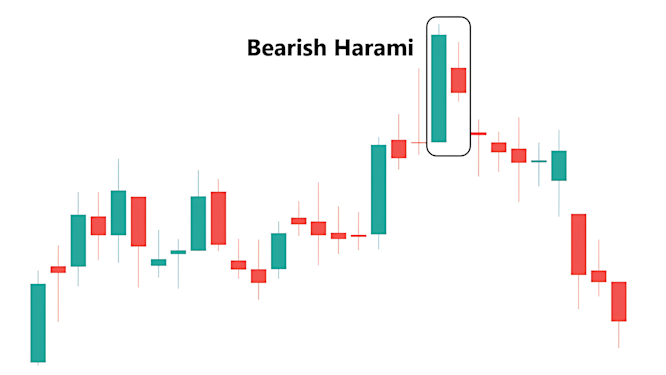
Bearish Harami is a two-candle pattern that may appear on a chart during an upswing. It signals that the trend 'might' shift from upward to downward. The term 'Harami' may seem strange to us Indians, but in Japanese, it signifies pregnant.
For the pattern to be dubbed 'Bearish Harami', the following must occur:
1. The first candle must be huge and green (bullish).
2. The second candle should be red (indicating a negative sentiment).
3. The second red candle should be smaller and placed in-between the previous green candle.
Psychology of Bearish Harami
A stock has been growing over the previous several days. One day, a large green candle appears on the chart, indicating that buyers have entire control.
The following day, the stock starts with a gap down. Given the price drop, those who are long (keeping) the stock are concerned that it has reached its short-term peak and will continue to plummet.
They sell their stakes, lowering the price further. Buyers' hold is diminishing as prices decline. The sellers are attempting to gain control.
On the third day (the day following the development of Bearish Harami), if the stock continues to decline, it confirms that the trend is likely to reverse at least in the near term - and the price may correct.
Bearish Harami Trading Strategy
The 'Bearish Harami' pattern performs rather well across all time periods. It is not as popular as the 'Bearish Engulfing', but the 'Bearish Harami' is quite common and appears frequently on charts.
Intraday traders may see 5 minute, 10 minute, and 15 minute charts. If the 'Bearish Harami' occurs on either of these time frames, and the following candle after the pattern is bearish, a trade may be made. For short or medium-term bets, consider the 60-minute, daily, and weekly options.
Here’s a frequent approach employed to trade the ‘Bearish Harami’:
When the 'Bearish Harami' pattern appears on the chart, traders wait for the following candle to confirm a short-term trend shift.
• If the next candle is also red, traders can sell or short the stock.
• The stop loss is set at the top of the first green candle in the 'Bearish Harami' pattern.
Bearish Harami Example:
The chart below is for HCL Technologies. It displays the 'Bearish Harami' candlestick pattern, which occurs after an increase. The 'Bearish Harami' is followed by a trend reversal, which means that a stock that was rising has reversed and is now dropping.
Check out this chart:

The two candles depicted in the box represent the 'Bearish Harami' candlestick pattern. I hope this is obvious.
When searching for this or any other candlestick pattern, keep one thing in mind. The price change is what makes these candles.
Therefore, the designs will never be flawless. Occasionally, the second candle may be somewhat higher. It might be lower. There could be a big shadow.
Candles may take many forms and sizes. The naming of these designs themselves is not particularly relevant. We must concentrate on the price activity and attempt to determine why the candle has formed.
When you glance at the chart and notice a pattern that resembles the 'Bearish Harami', use cautious. If you have a short-term trade, you should examine it more attentively and watch how the price reacts on the following candle. If the price falls further, it might be a confirmation of a shift in trend.
Importance of Volume and Overall Market Movement in Bearish Harami
A few key factors for 'Bearish Harami' to function more efficiently. If the second red candle has a bigger volume than the first green candle, it is regarded more indication that sellers are attempting to grab control.
Additionally, keep an eye on the overall market movement. If the second red candle of the pattern forms on a day when the market is doing well, the chances of the stock plummeting rise.


